Farmland Value Trends: Current Landscape and Insights

As we navigate through 2024, it’s crucial to examine the latest trends shaping the farmland market. Understanding these trends informs investment decisions and provides valuable insights into the broader economic implications in the future. This article explores market shifts over the past 12 months and the anticipated outlook for the remainder of 2024.
The Compeer Financial appraisal team tracks 53 benchmark farmland properties through Minnesota, Wisconsin, Illinois, Iowa and Indiana. These benchmarks are assessed on a monthly basis for real-time market trends to help us stay abreast of what’s going on in the agriculture real estate market. The most recent valuations for these properties occurred as of July 1, 2024, and are compared to the previous year July values.
Benchmark Farmland Value Trends
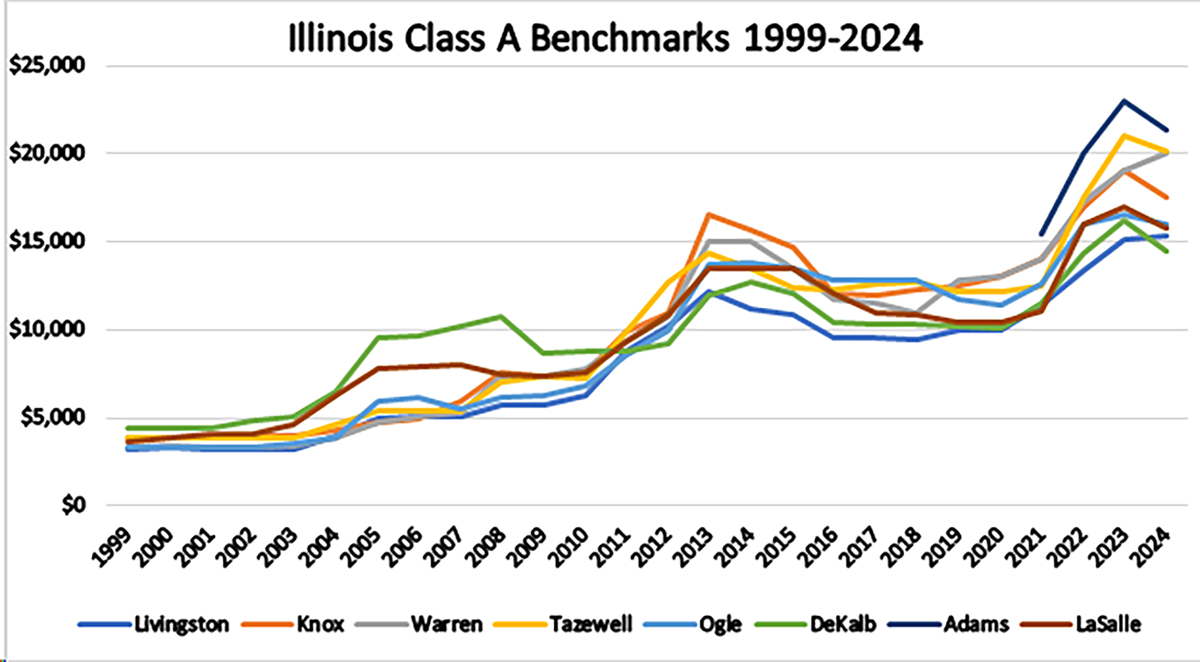
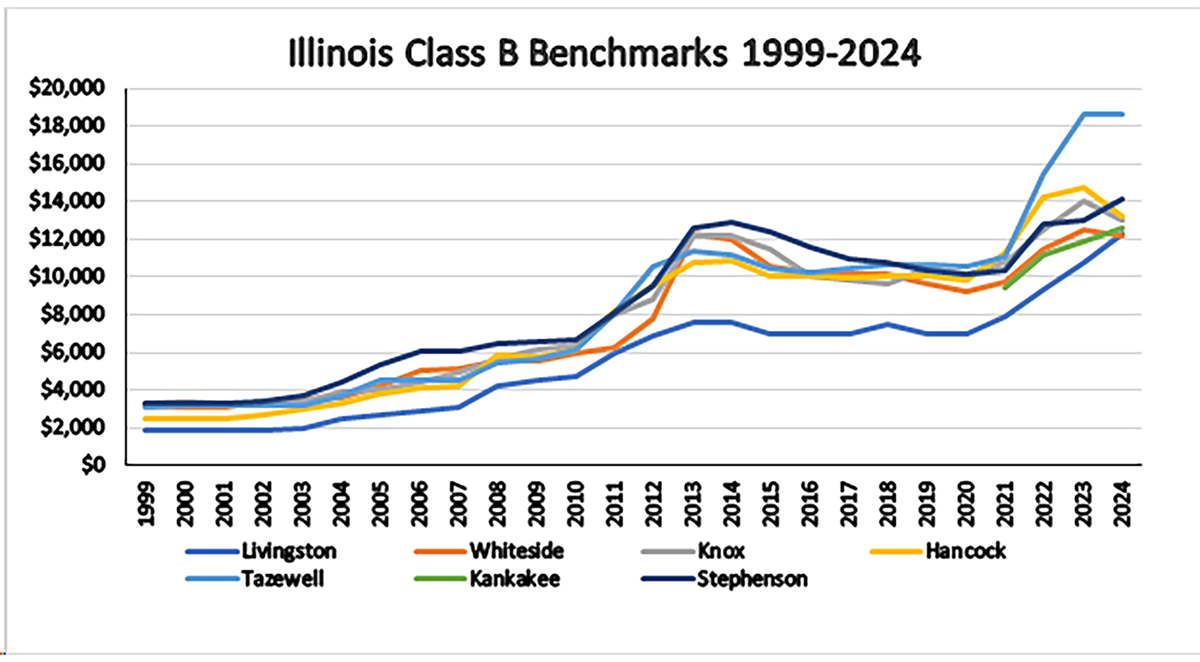
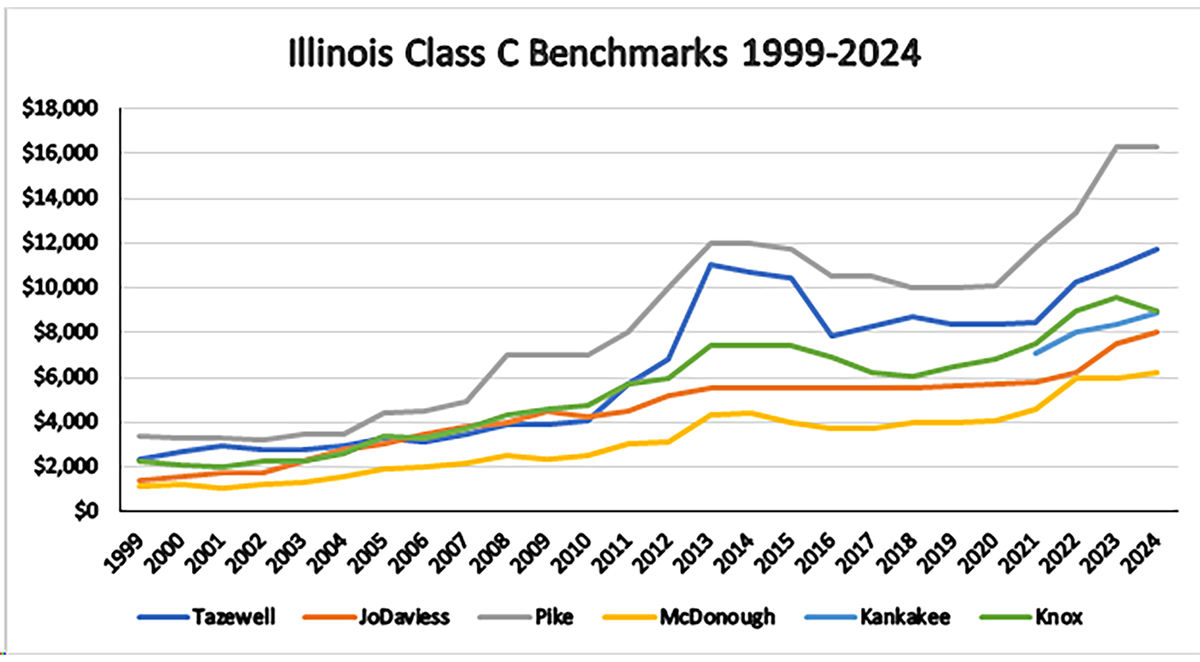
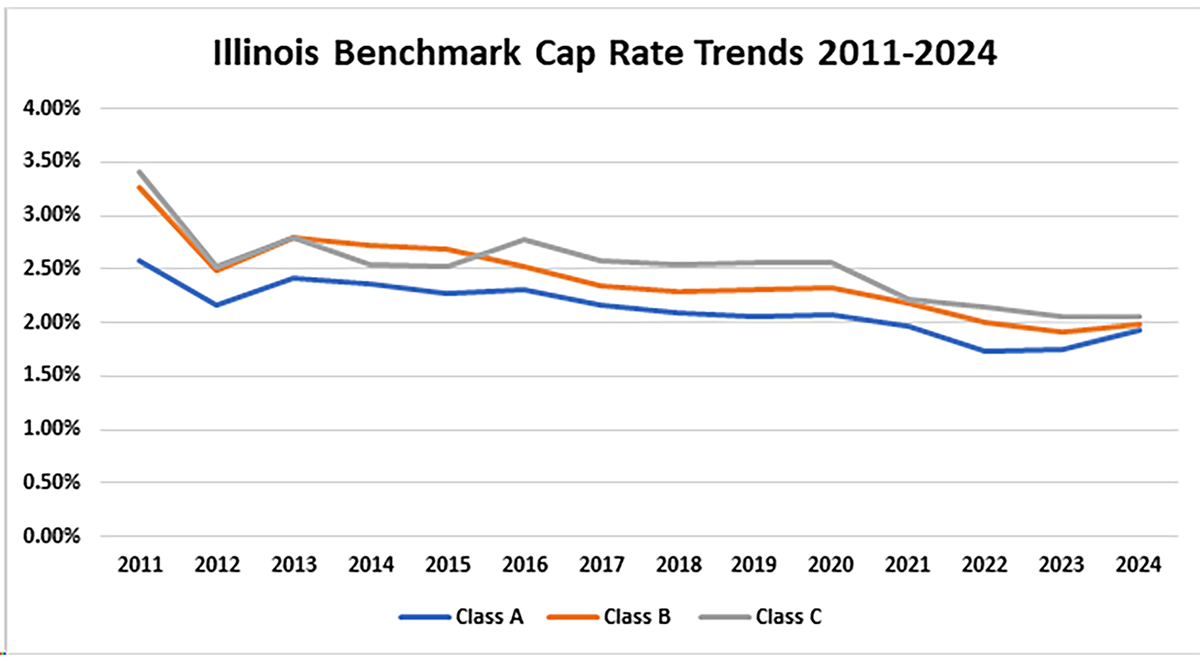
Illinois
Class A farms indicate an average one-year decline of 4.2%, while Class B farms shows a minimal increase of 1.5% and Class C farms have an upward movement of 5.8%.
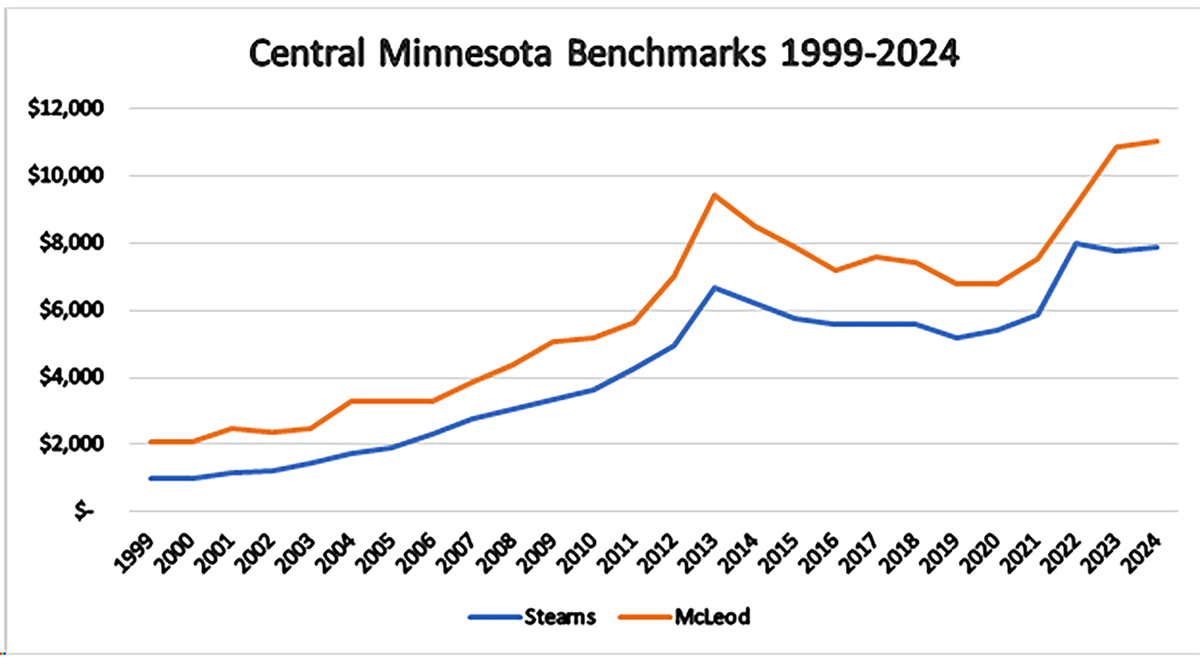
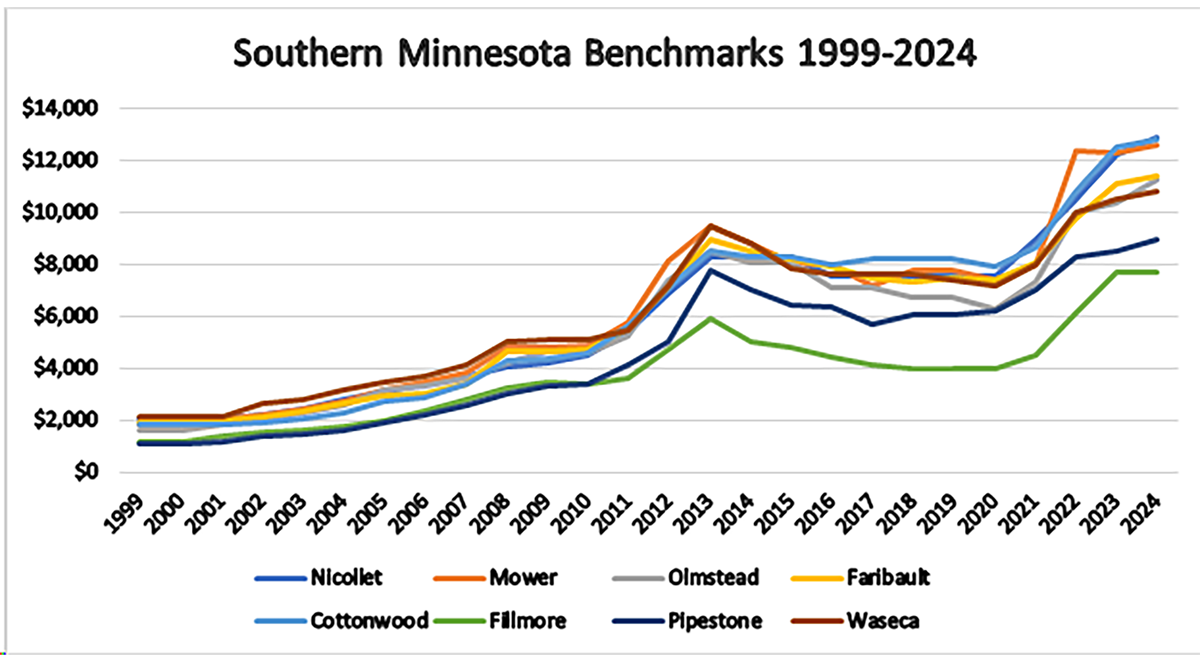
Minnesota
Central Minnesota benchmarks show minimal increase over a one-year time period of 0.5%. The southern Minnesota benchmarks had a slight shift upwards over a one-year time period with an average of 3.8% movement.
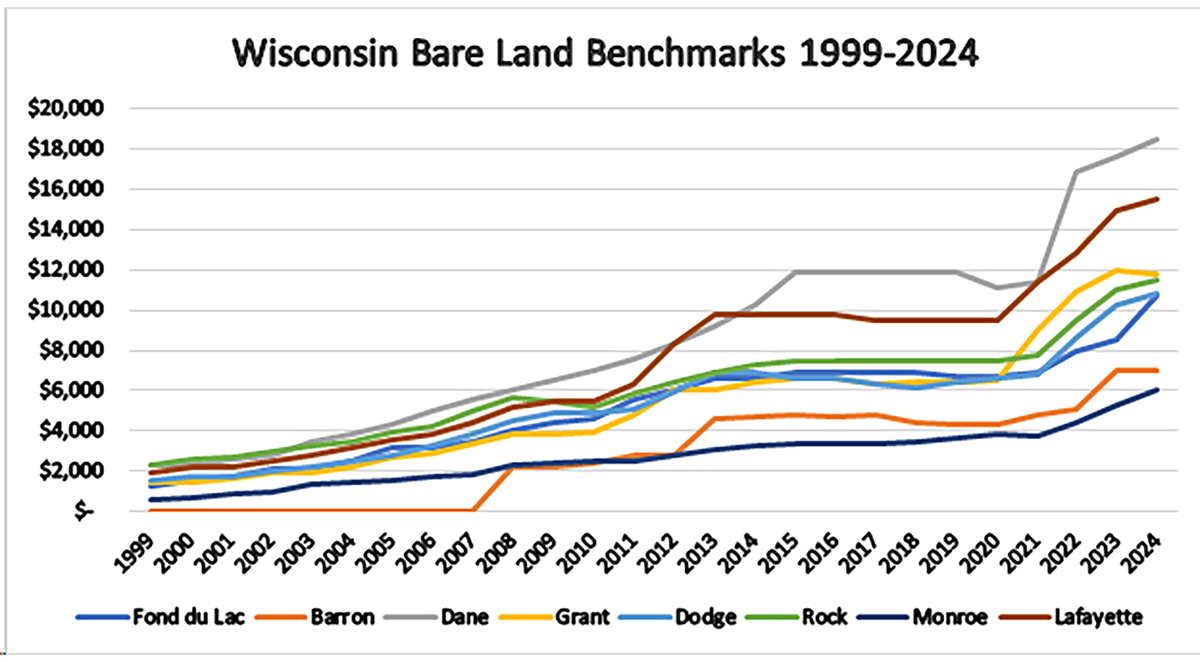
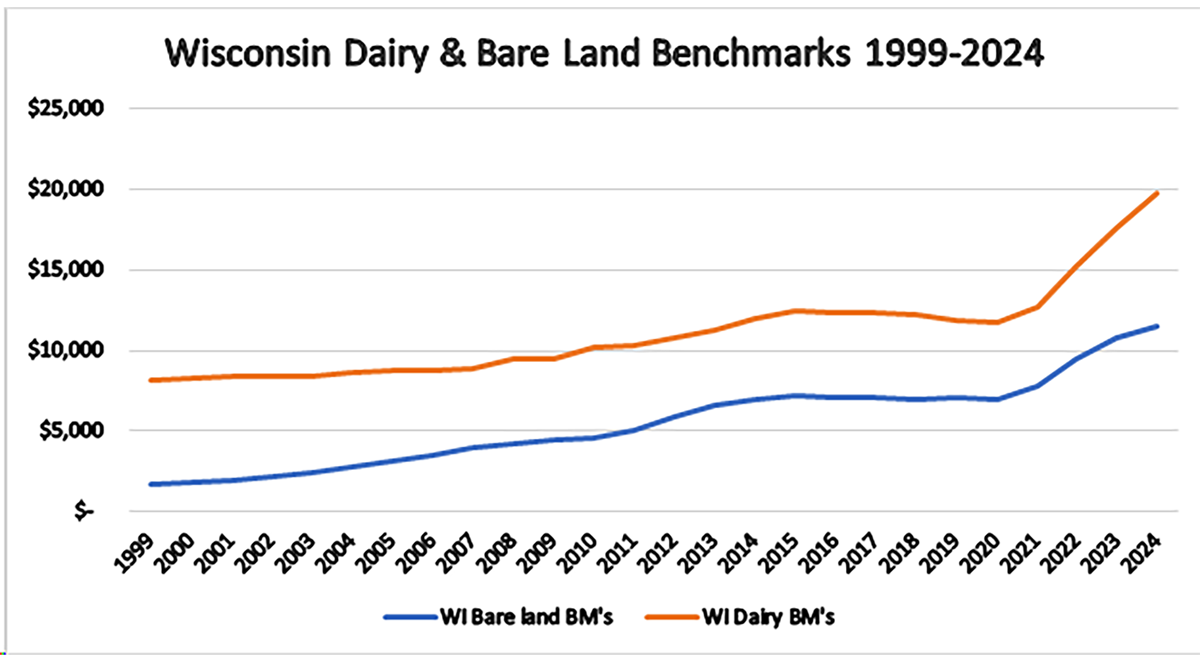
Wisconsin
Wisconsin bare land benchmarks show and average one-year upward movement of 8.0%. The dairy benchmarks indicate a very similar increase of 8.5%.
Capitalization Rates and Cash Rent
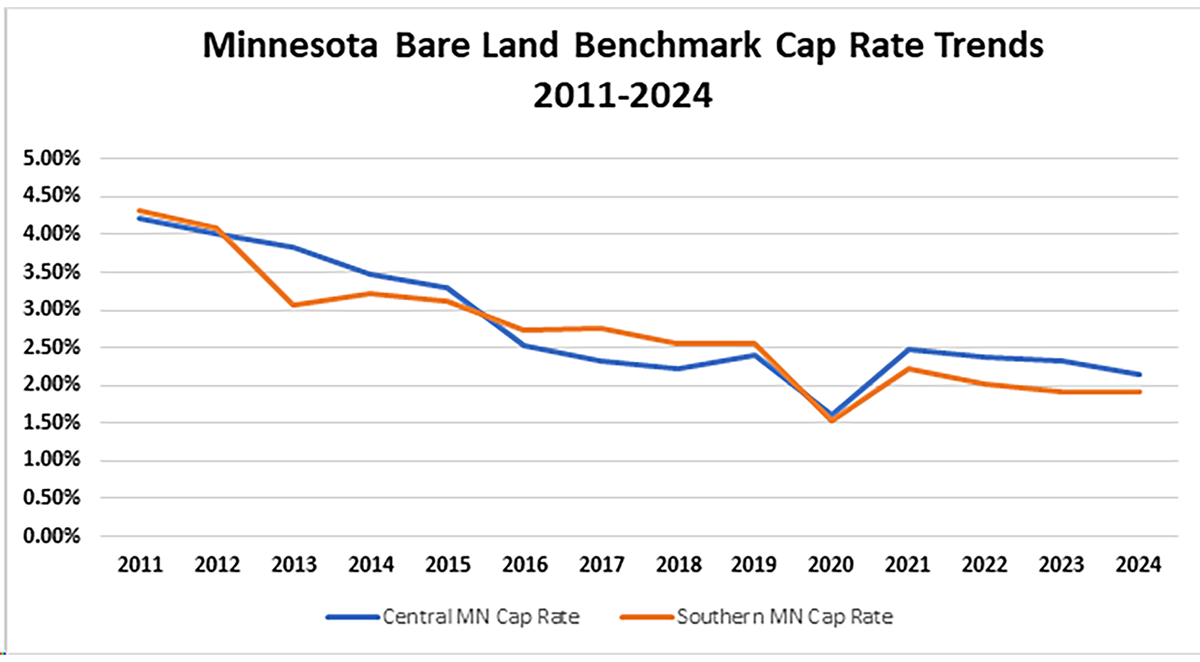
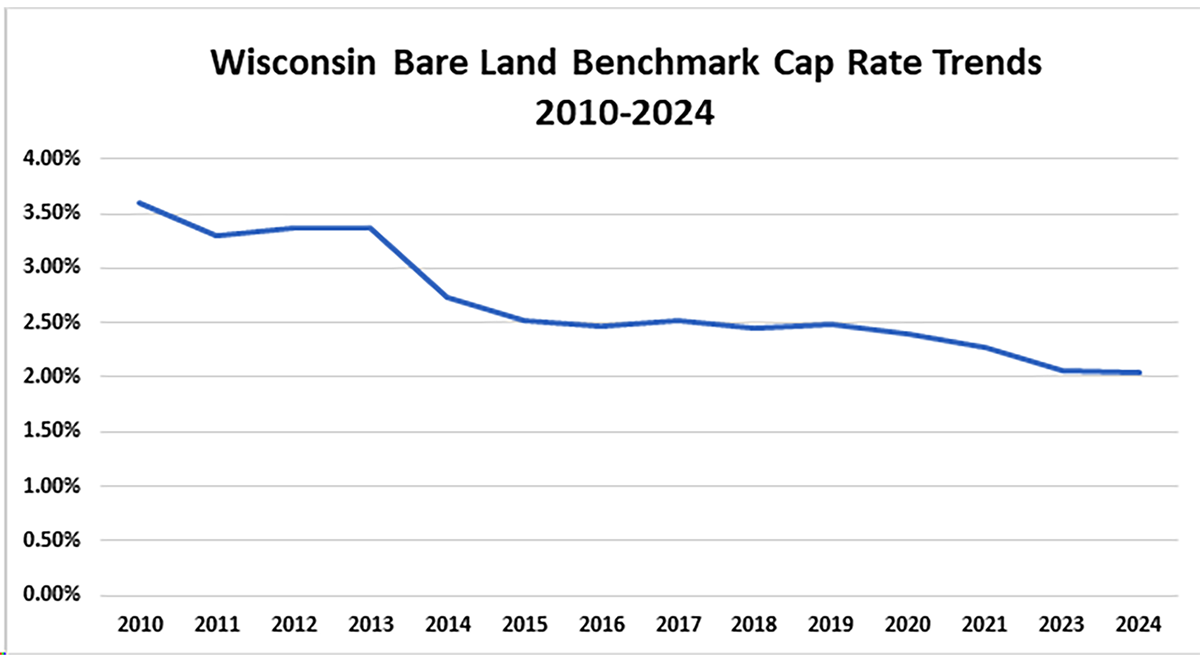
As farmland values have risen over the past four years, our three-state territory has experienced a general decline in capitalization rates, commonly called cap rates. Increasing rents and declining cap rates typically indicate a strong and competitive real estate market. However, with ongoing negative pressures on profit margins, cash rents are expected to stabilize and cap rates are anticipated to return to historical levels of 2.0-3.0%.
Illinois
Minnesota
Wisconsin
2024 Year-End Outlook
Commodity Prices & Profit Margins
Since August 2023, corn prices have fluctuated between $4.00-$5.00 per bushel, staying below $4.50 since early 2024. The USDA’s, World Agricultural Supply and Demand Estimates (WASDE) July report states an average 2024 corn price of $4.40, down from $4.75 in 2023. While the USDA has not projected a price for 2025, futures markets suggest a further decline in pricing. Deteriorating commodity prices are largely influenced by market supply. The July report indicated global ending stocks for the 2023/2024 marketing year are higher than expected for wheat and soybeans and lower than expected for corn. The 2024 new crop is experiencing favorable growing conditions. The percentage of corn crop with good or excellent ratings are 75% in Illinois, 58% in Minnesota and 61% in Wisconsin. The soybean crop also looks favorable, with 76% rated good or excellent in Illinois, 57% in Minnesota and 60% in Wisconsin.
Interest Rates
In response to inflationary pressures, the Federal Reserve has implemented a series of strategic incremental interest rate hikes to bring inflation back to historical target rates. Consequently, rates are now at their highest level in a decade. While inflation has steadily declined since its peak in April 2022, it has yet to stabilize at the target rate. The June 2024 Federal Reserve meeting concluded with interest rates remaining unchanged, aiming to further reduce inflation. If inflation continues to decrease, the Fed hopes to implement a single 25 basis point rate cut by year-end.
Land Market Supply and Demand
Farm sales in volume has decreased, leading to a tight supply. Over the past 12 months, demand has consistently outstripped supply. This typically leads to an active market, but the abundance of cash in the market is diminishing, which has likely tempered the market’s intensity. Farmers still constitute nearly 80% of the buyers in the farmland market. With the stabilization and confidence returning to the stock market, farmland investors have reduced activity in efforts to balance portfolios.
-270x321-53b70be.png?ext=.png)
Previous Historical Similarities and Future Forecast
Looking back in time, land values began their most recent climb to record levels supported by historically high prices commodity prices in 2021. A similar period of historically high commodity prices occurred from 2011-2013. During that time, our benchmark farms saw significant increases in value: 49% in Illinois, 64% in Minnesota and 31% in Wisconsin. However, by August 2013, corn prices dropped below $5.00 per bushel and stayed there until the end of 2020, mostly trading between $3.00-$4.00 per bushel. At the same time, our benchmark farms in the primarily row-crop states of Illinois and Minnesota steadily decreased by 16% and 18%, respectively.
Conclusion
The land market is inherently dynamic, with fluctuations in values to be expected. Trendlines in 2024 across our three-state territory indicate a stabilized market. The year-over-year percentage change in value for our benchmark farms reflect typical market movements, suggesting stability.
A modest market correction was anticipated for 2024 and this shift is now reflected in a stabilized market. While negative pressures from commodity prices, interest rates and expected low sales volume will continue to influence pricing throughout 2024, the market is expected to remain stable in the short term. Historical trends suggest that any recession will likely progress at a gentle pace.
For access to these monthly insights, subscribe to our monthly appraisal e-newsletter and listen to our Appraisal Report podcast. Our team of certified appraisers help farmers and farmland investors make informed decisions and get answers to burning questions.
And if you’re looking for financing to invest in farmland, contact our agricultural lending team to see how the leading farmland lender in the Upper Midwest can help you reach your goals.